Need help? We're here!
(888) 312-8812 Login SignupDangerous Truck Roads: The 10 States with the Most Hazards
July 17, 2024

When you plan a trucking route, it's essential to be aware of the potential risks associated with the roads you'll be traveling on. There are a number of factors to consider: chances of inclement weather, rough road conditions, the amount of traffic you'll encounter, and how frequently accidents occur on a given highway. Certain highways consistently appear in lists of the most hazardous trucking routes in America due to factors like high traffic, tight curves, and frequent accidents.
Your routes can take you anywhere in the country, so we analyzed data points from a range of authoritative sources to assess which states have the most dangerous roads for trucks (and which states have the safest roads).
Key Findings:
-
The state with the most dangerous truck roads is California.
-
Maryland and Delaware, two relatively small states, had the highest large truck crash rates per 100 miles.
-
Despite their unforgiving winters, Vermont, North Dakota, and Alaska have the statistically safest roads for semi-trucks.
Ahead, we'll break down the states with the most dangerous and safest roads for trucks and give tips on how to drive safely no matter where your route takes you.
Table of Contents:
Summary of Key Metrics
To create our proprietary safety scoring, we combined these four road safety metrics from six reputable sources and broke them down on a state-by-state basis:
-
Number of fatal and non-fatal large truck crashes per 100 miles
-
Extreme weather score
-
Number of congested & deadliest highways
-
Worst road conditions
By assigning weights to each of these metrics, we were able to find an overall road safety rating for all 50 states. Of these metrics, crashes per 100 miles was especially influential.
-
Maryland had the highest rate at 5.68 crashes per 100 miles.
-
Alaska had the lowest rate at 0.16 crashes per 100 miles.
-
Wyoming had the median rate at 1.81 crashes per 100 miles.
These numbers correspond with broader truck accident statistics every trucker should know and provide context for understanding the risks in each state.
If you want to see the full state-by-state rankings for crashes per 100 miles, you can check out our full table at the bottom of the page to see how states outside of our top 10 performed.
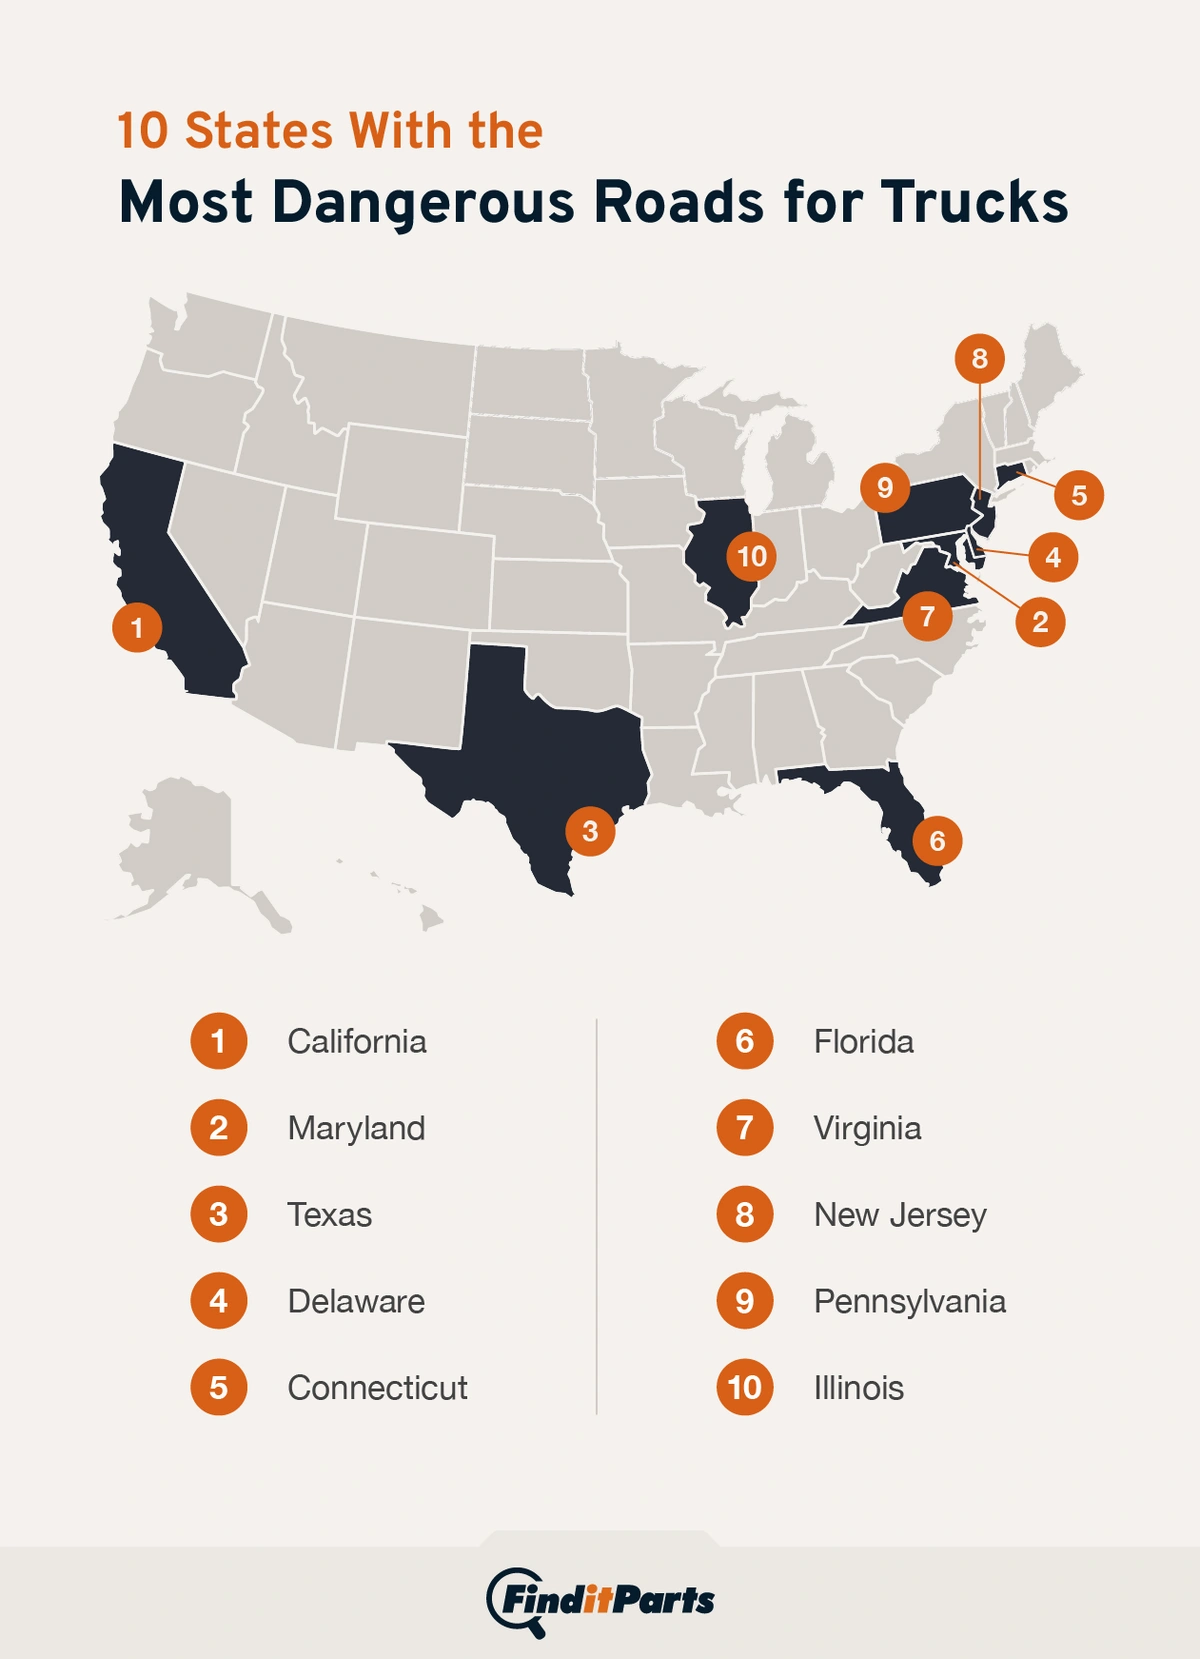
States With the Most Dangerous Roads for Trucks
In order to rank the states with the most dangerous roads for trucks, we used 2023 data from the Federal Motor Carrier Safety Administration (FMCSA) to determine the number of large truck crashes per 100 miles. We also looked at inclement weather data, overall road conditions, and the number of congested and dangerous highways that cut through each state. And given how many people have concerns about self-driving trucks, it's worth noting that the gradual rollout of this technology could affect these statistics in future years as well.
1. California
-
7th most crashes per 100 miles
-
3rd worst road conditions
-
9 of the most dangerous/congested roads
California has the most dangerous roads for trucks in the United States. The state has a high rate of crashes involving large trucks (3.38 per 100 miles) and the third-worst road conditions in the country. It also has nine highways that rank among the most dangerous and congested U.S. roads.
California is a massive state with a wide variety of climates and terrains, so certain regions may have a higher likelihood of extreme weather and unsafe roads than others. Knowledge of safe driving around semi-trucks is crucial for navigating busy highways and congested areas safely.
Notable Roads: I-5, I-15, I-40, I-80
2. Maryland
-
Highest crash rate per 100 miles
-
2 of the most dangerous/congested roads
Despite being smaller and less populous than other states on this list, Maryland has the highest rate of fatal and non-fatal large truck crashes, at 5.68 per 100 miles. This makes it one of the most dangerous states for truck drivers despite having good road conditions and moderate weather.
Notable Roads: US 1, I-83
3. Texas
-
8th most crashes per 100 miles
-
13th worst weather conditions
-
20 of the most dangerous/congested roads
In 2023, Texas had the highest number of crashes involving large trucks (20,510) and a rate of 3.13 crashes per 100 miles. Texas also has 20 highways that rank as dangerous or congested—the highest number in the nation. Awareness of common causes of truck accidents and prevention strategies is important for reducing risks on these heavily trafficked roads.
Notable Roads: I-20, I-35, I-30
4. Delaware
-
2nd most crashes per 100 miles
Delaware has the second highest crash rate in the country (4.44 large truck crashes per 100 miles) while also having the third lowest total road miles of any state (13,613). This means that truckers have a higher chance of being involved in a collision in Delaware than in bigger, busier states.
Notable Roads: US 13, US 1
5. Connecticut
-
4th most crashes per 100 miles
-
5 of the most dangerous/congested roads
Similar to Delaware and Maryland, Connecticut has a very high semi-truck crash rate (3.8 per 100 miles) despite low overall road mileage (45,552). Additionally, its I-84 and I-95 highways are known for being heavily congested and prone to bottlenecks.
Notable Roads: I-95, I-84
6. Florida
-
3rd most crashes per 100 miles
-
5 of the most dangerous/congested roads
With 3.88 crashes per 100 miles, Florida has the third highest large truck crash rate in the country. It also has five dangerous or congested highways, with I-4, the interstate connecting Florida's flagship theme parks, being particularly deadly (1.13 deaths per mile).
Notable Roads: I-95, I-4, US 92
7. Virginia
-
5th most crashes per 100 miles
-
1 of the most dangerous/congested roads
Virginia has a large truck crash rate of 3.54 per 100 miles—the fifth highest in the U.S. Although it ranks favorably in areas like extreme weather and road conditions, this statistic shows that truckers in Virginia have a relatively high risk of being involved in a collision with other drivers (and that risk increases on I-95).
Notable Roads: I-95, I-66
8. New Jersey
-
9th most crashes per 100 miles
-
11th worst road conditions
-
3 of the most dangerous/congested roads
In addition to having the ninth highest semi-truck crash rate (3.07 per 100 miles), New Jersey has three heavily congested highways (I-95, I-676, and I-295) and the 11th worst road conditions in the country.
Notable Roads: US 22, I-95, I-76
9. Pennsylvania
-
10th most crashes per 100 miles
-
4 of the most dangerous/congested roads
Pennsylvania had 7,524 fatal and non-fatal large truck crashes in 2023. With 253,838 total road miles in the state, this puts its large truck crash rate at 2.96 per 100 miles. It also has four congested highways grouped around the city of Philadelphia, which is a particularly dangerous metropolitan area to drive through.
Notable Roads: I-78, I-83, I-80
10. Illinois
-
15th most crashes per 100 miles
-
3rd worst weather conditions
-
10th worst road conditions
-
6 of the most dangerous/congested highways
Illinois has the 15th highest crash rate (2.4 incidents per 100 miles) and the 10th worst road conditions in the country. It also has six of the most congested highways, all of which pass through or around Chicago.
Notable Roads: US 11, I-55
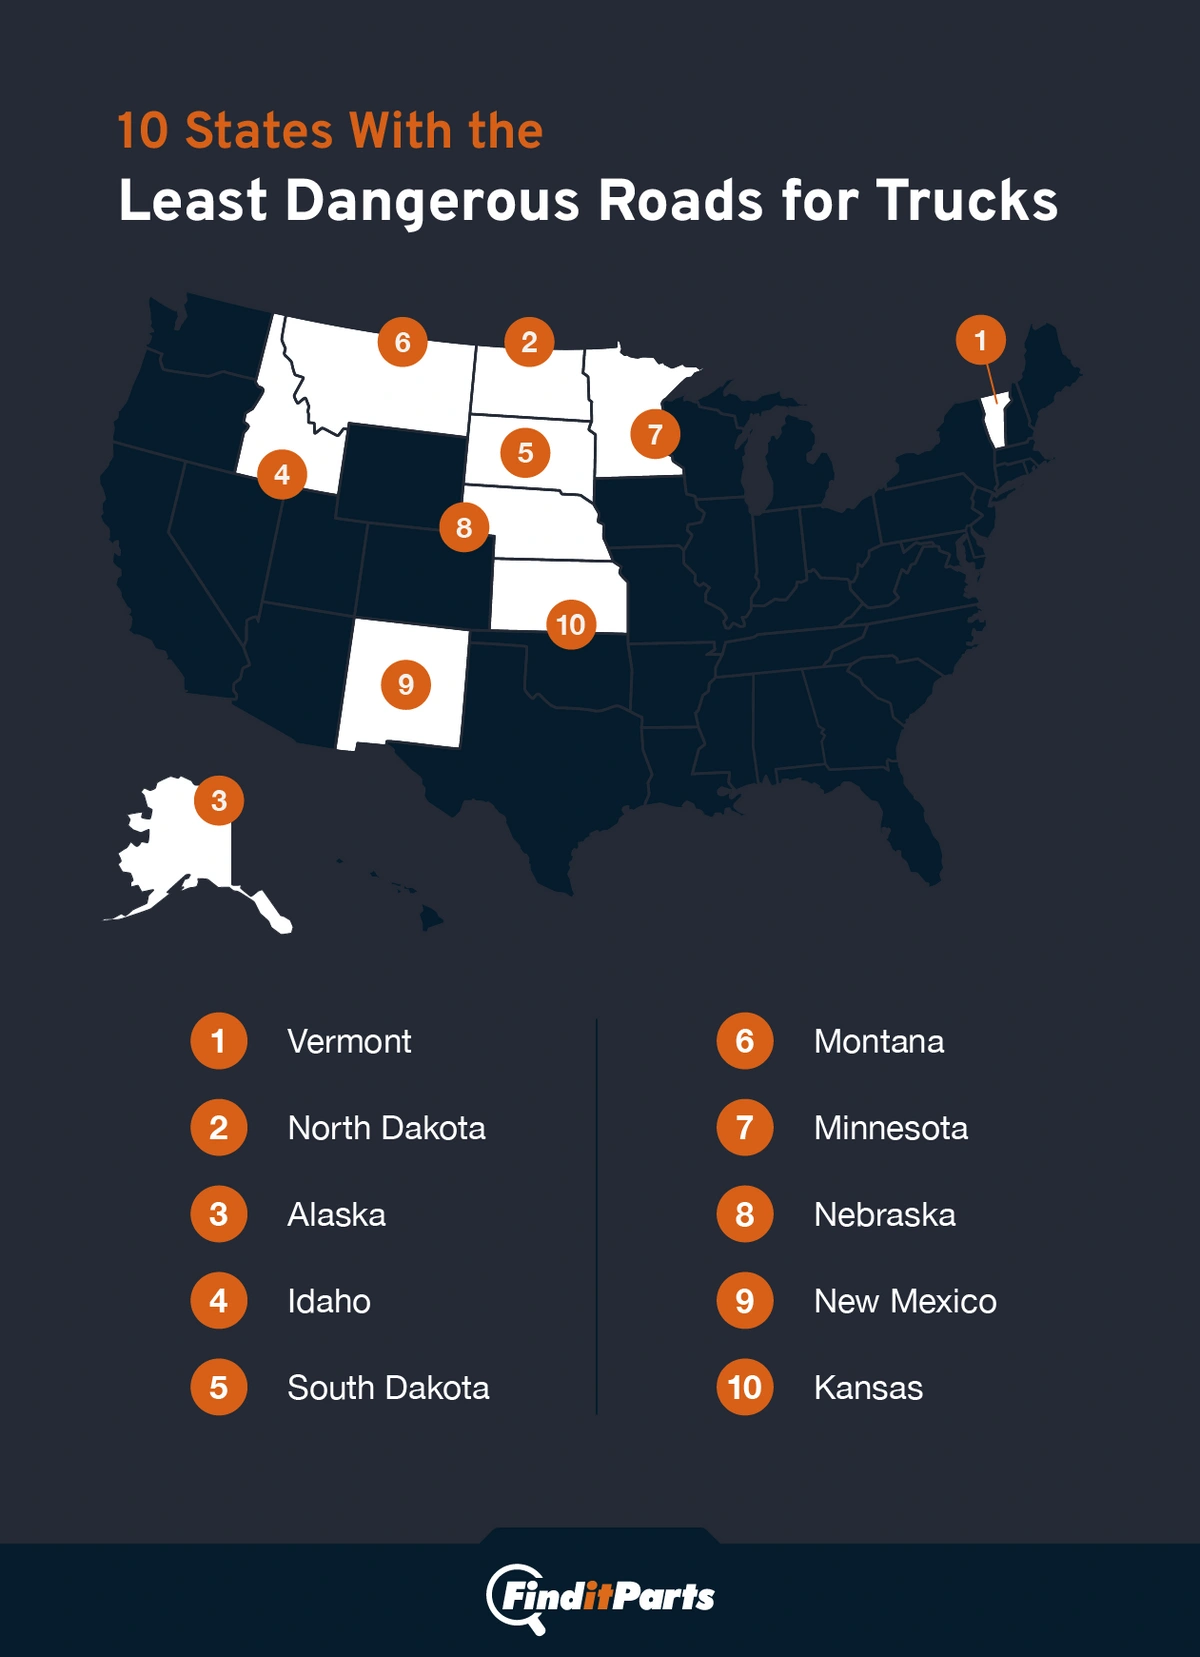
States With the Least Dangerous Roads for Trucks
Using the same data sets outlined above, we also identified the 10 states with the least dangerous truck roads. These states had the lowest overall truck crashes per 100 miles and received mixed rankings for inclement weather, road conditions, and congestion.
It's worth mentioning that most of these states also have low total driver volume, which helps explain why truck drivers have reduced chances of crashing within their borders.
1. Vermont
-
6th lowest crashes per 100 miles
-
5th best road conditions
-
7th best weather conditions
Based on collision data from 2023, Vermont has the sixth lowest large truck crash rate in the country (0.58 per 100 miles). It also has the fifth best overall road conditions and low rates of extreme weather, making it the state with the safest overall roads for trucks.
2. North Dakota
-
3rd lowest crashes per 100 miles
-
12th best road conditions
North Dakota has the third lowest number of semi-truck crashes per 100 miles (0.35), which makes it statistically one of the safest states for truck drivers despite having a high degree of inclement weather.
3. Alaska
-
Lowest crash rate per 100 miles
Alaska is one of the least populous states, but its incredibly low large truck crash rate (0.16 per 100 miles) remains a surprising statistic, especially in a place known for its extreme weather conditions.
4. Idaho
-
8th lowest crashes per 100 miles
-
7th best road conditions
Idaho has the fourth least dangerous truck roads thanks to a very low semi-truck crash rate (0.72 per 100 miles) and the seventh best road conditions in the nation.
5. South Dakota
-
2nd lowest crashes per 100 miles
South Dakota has one of the lowest overall truck crash rates (0.32 per 100 miles). It is slightly less safe than its neighbor North Dakota due to poorer road conditions and more extreme weather.
6. Montana
-
4th lowest crashes per 100 miles
Montana reported the fourth lowest large truck crash rate (0.52 per 100 miles) in 2023. However, it does not score as well on road conditions and weather. With this in mind, it's important for drivers to exercise caution even in states with relatively uncrowded highways. During periods of extreme weather, traffic, or construction, any road can become dangerous.
7. Minnesota
-
9th lowest crash rate per 100 miles
-
Best overall road conditions
Minnesota is one of the more populous states to rank among the safest for truck travel, posting a low semi-truck crash rate of 0.82 and earning top marks for road conditions nationwide. Even with these advantages, truckers can further reduce risk by staying mindful of personal safety on the road, especially when traveling through rural routes, rest areas, or low-traffic locations.
8. Nebraska
-
5th lowest crashes per 100 miles
Nebraska has nearly 200,000 total miles of road, but its large truck crash rate is only 0.58 per every 100 miles. Though it may not have the clearest weather or smoothest roads, truck drivers have a low chance of getting in an accident in the Cornhusker State.
9. New Mexico
-
7th lowest crashes per 100 miles
New Mexico does not score particularly well when it comes to inclement weather (ninth worst) and road conditions (13th worst), but it has the seventh lowest crash rate for large trucks (0.62 per 100 miles). While this may be due in part to low overall population, truck drivers aren't likely to be involved in an accident on this state's highways.
10. Kansas
-
10th lowest crashes per 100 miles
Known as the country's agricultural heartland, Kansas also boasts America's 10th lowest semi-truck crash rate (0.87 per 100 miles). However, drivers should be aware that the state has a high average number of tornadoes each year.
Large Truck Crashes per 100 Miles
The rate of large truck crashes per 100 miles is a key metric we used to calculate how hazardous (or safe) a state is for truck drivers. We only ranked the top ten states for each category and calculated these figures into our weighted scoring, but for added context, you can see the full data set for this metric here.
|
Large Truck Crashes Per 100 Miles Ranked by State |
||||
|
1. Maryland: 5.68 |
11. North Carolina: 2.96 |
21. Missouri: 2.03 |
31. New Hampshire: 1.31 |
41. Kansas: 0.87 |
|
2. Delaware: 4.44 |
12. Louisiana: 2.87 |
22. Hawaii: 1.92 |
32. West Virginia: 1.22 |
42. Minnesota: 0.82 |
|
3. Florida: 3.88 |
13. Indiana: 2.64 |
23. New York: 1.92 |
33. Washington: 1.22 |
43. Idaho: 0.72 |
|
4. Connecticut: 3.8 |
14.Massachusetts: 2.63 |
24. Kentucky: 1.91 |
34. Mississippi: 1.17 |
44. New Mexico: 0.62 |
|
5. Virginia: 3.54 |
15. Illinois: 2.4 |
25. Wyoming: 1.81 |
35. Utah: 1.17 |
45. Vermont: 0.58 |
|
6. Georgia: 3.43 |
16. South Carolina: 2.34 |
26. Alabama: 1.79 |
36. Wisconsin: 1.06 |
46. Nebraska: 0.58 |
|
7. California: 3.38 |
17. Michigan: 2.31 |
27. Maine: 1.69 |
37. Nevada: 1.05 |
47. Montana: 0.52 |
|
8. Texas: 3.13 |
18. Ohio: 2.29 |
28. Oregon: 1.54 |
38. Oklahoma: 1.02 |
48. North Dakota: 0.35 |
|
9. New Jersey: 3.07 |
19. Tennessee: 2.25 |
29. Arkansas: 1.41 |
39. Colorado: 0.99 |
49. South Dakota: 0.32 |
|
10. Pennsylvania: 2.96 |
20. Arizona: 2.1 |
30. Rhode Island: 1.35 |
40. Iowa: 0.91 |
50. Alaska: 0.16 |
Tips for Driving on Hazardous Roads
Remember, just because a state's roads have statistically lower rates of large truck crashes doesn't mean they're completely safe year-round. And while you can't control how hazardous or safe the roads you're driving are, no matter where you're going, there are a number of things you can do to reduce the likelihood of a crash:
- Plan your trip ahead of time: It's always best to plan ahead, particularly when passing through areas known for poor weather and road conditions. The night before your trip, check the forecast for the cities you'll be hitting on your route.
- Perform regular inspections: Ensuring your vehicle is road-ready and safe to operate is critical, especially if you're driving on dangerous roads or in places with frequent rain and snow. Keep track of your mileage so you know when you're due for maintenance.
- Slow down in inclement weather: Extreme weather conditions can result in slick or icy roads and poor visibility. If you're driving through rain, snow, or hail, be sure to reduce your speed and increase your following distance. It's important to note that even if a road is considered safe by our metrics, poor weather and other conditions can make it more dangerous.
- Stay off your cell phone or other devices: While this may seem like a no-brainer, using a cell phone while driving makes the highway a more dangerous place for you and everybody around you. Keep your eyes on the road and wait until you're stationary if you need to text or make a call.
- Drive defensively in heavy traffic: Driving on highly congested highways can put you at greater risk of a collision. In start-stop traffic, try to maintain a following distance of two to four seconds in case the vehicle in front of you slams on its brakes. Also, watch out for sudden lane changes and drivers who aren't aware of your blind spots.
- Remember basic safe driving practices: The basics of safe driving are basic because they work. Always wear your seat belt, follow the speed limit and other road signs, and never drive while under the influence.
Whether you're tackling dangerous truck roads or not, FinditParts offers all the heavy-duty trucking parts you need to make your journey go smoothly. By spreading awareness of road safety levels by state, we hope to help truck drivers plan their routes carefully and efficiently. For even more safety insights, see our full list of notable truck accident statistics.
Methodology
To determine the most dangerous truck roads by state, we collected and analyzed crash data from the FMCSA and mileage information from the Federal Highway Administration (FHWA). We also drew from research conducted by the American Transportation Research Institute (ATRI), along with carefully sourced studies on road conditions, weather, and highway fatality rates. These factors were weighted and scored to calculate the final rankings.
Sources
Crash Statistics. FMCSA | Lane Miles by State. FHWA | Top 100 Truck Bottlenecks. ATRI | Most Dangerous Roads. Teletrac Navman | The Worst Roads in America. ConsumerAffairs | U.S. States With the Most Extreme Weather. Filterbuy


